Smart Data Center
Cloud Center
Overview
System Architecture
The Cloud Center architecture is organized into four primary layers: Presentation Layer, Application Layer, Domain Layer, and Infrastructure Layer. Each layer serves distinct functions and contains specific services essential for the overall system’s operation.
The Presentation Layer is responsible for handling interactions between the cloud system and its users. We assume there are two types of users, the project maintainers and the project contributors. The Presentation Layer provides a user interface for project maintainers to manage their projects and for project contributors to access and contribute to the projects. The Presentation Layer also provides an interface for the system administrators to monitor and manage the system. and customers who use this system. The Presentation Layer is implemented as a web application that can be accessed through a web browser.
The Application Layer contains platforms and services that support operations, includes Data Product Platform and Data Processing Platform.
Data Product Platform aims at customers who can select datasets and downloads datasets, which enhancing the experience by providing ai-based search mathods and a variety of usecases for customers to choose.
Data Processing Platform is especially designed for project maintainers to process data, which includes data cleaning, data transformation, data integration, data analysis, and data visualization.
Data Collection Platform is designed for engineers who collects data. Offering preprocessing modules likje sensor configuration, data monitoring, data collection, and data storage and compress data structure.
When it comes to Domain Layer, where key algorithm and technologies are implemented. The Domain Layer contains the core logic of the system, including data Assenbly, Publish, Benchmark, Evaulate of Data Management Sevices, simultaneously, with Tranform, Compress, Filtering, Encoding, Mask, Grouping and Slicing of Dataset Processing Services.
The Infrastructure Layer is responsible for managing the system’s hardware and software resources. The Infrastructure Layer includes the following components: Compute, Storage, and Network. Network is now locally distributed network with only a website universally accessible. The whole toolchain include MongoDB and MQTT protocol for data storage and transmission. NAS for data storage and processing. A website is deployed on computing server using React and Flask.

Dataflow

Components

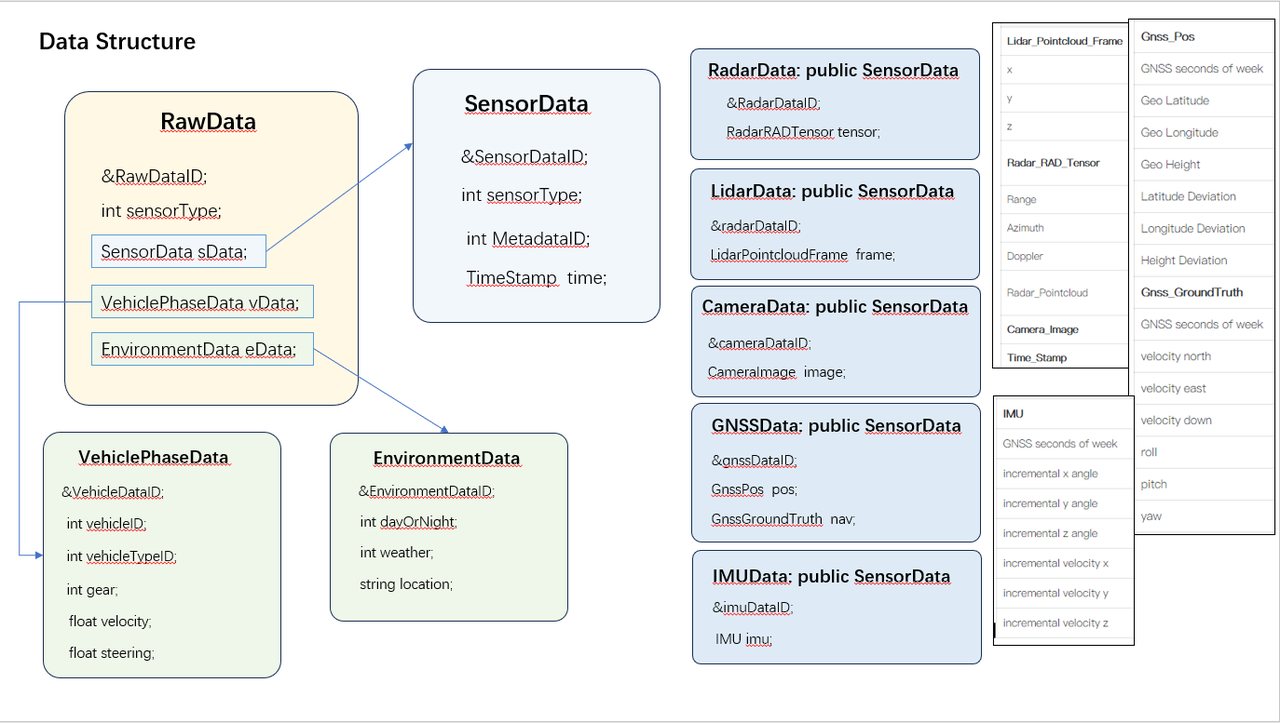
Data Structure
The Data Strucutruefor Cloud Center is rather important because the bandwidth for data transmission is limited. In order to satisfy online preview and labeling information, it is necessary to compress the data structure. The data structure is designed as follows:
We classify the sensor data with RadarData, LidarData, CameraData, LidarData and GNSSData. Each data will be designed suitable for online preview and processing, it is more efficient than compressing raw data.
Data Process Pipeline
The diagram below illustrates the data flow between an Autonomous Driving (AD) System, a Data Center, and a User Website.

Data flow for Data Processing after data collection.
The diagram depicts several key components:
AD System: This symbolizes the autonomous driving systems that collect various types of data from the vehicle’s operation.
Data Center Stage 1: The initial stage of the data center where data is first received and processed.
User Website: Represents the interface for users to access processed data or system insights.
Sensor Data: Data directly collected from the AD system’s sensors. This is typically the raw, unprocessed data gathered from vehicle sensors.
Original Data: The primary dataset that flows into the processing stage in the data center, before any substantial processing like aggregation or cleaning.
Raw Data: A more refined set of data that has been formatted or cleaned for better usability but still maintains its raw characteristics.
Meta Data: Information about the data itself, which might include details on how, when, and from where the data was collected.
The diagram also shows:
On Disk: Indicates where the data is stored in a physical medium, likely for persistence and backup purposes.
In Server: Denotes that the data is in active use or processing within servers, which could be part of real-time systems or for immediate access and analytics.
Understanding this flow is crucial for grasping how autonomous driving systems manage the substantial quantities of data they generate, store, and process.

Data flow for Car Data Collection.

Dataset Processing Pipeline.
Software Design
Usecase Design:

Usecase Design.
Based on these Usecase Design, we are able to give UI Design Based on Figma in a Ant Design theme.
You can view the detailed Figma Design in Figma Design.
Smart Data Center
System Architecture
The system is organized into three primary logical layers: the Access Layer, the Core Data Services Layer, and the Infrastructure Layer. It facilitates a closed-loop workflow from vehicle-side data acquisition to cloud-side storage, management, and visualization.
1. Access Layer
This layer serves as the system’s center, orchestrating workflows between the cloud and the vehicle edge. It is embodied by the Smart Data Center (SDC) suite:
- SDC Server
Acting as the central scheduler, it manages user requests via the API and Web interfaces. It coordinates data indexing instructions and dispatches tasks to edge devices.
- SDC Remote
A specialized lightweight agent deployed on the vehicle. It bridges the gap between local hardware and the cloud. Unlike passive loggers, SDC Remote actively communicates with the server to execute command-and-control tasks, managing the local HDF5 Storage and uploading data.
2. Core Data Services Layer
This layer implements the specialized logic for data management and retrieval. It consists of two distinct subsystems tailored for different data paradigms:
A. Highly Scalable Data Service (HSDS)
HSDS is implemented as a microservice-based architecture designed to handle HDF5-formatted multidimensional data. It allows for high-concurrency access and efficient slicing of large datasets without full-file downloads.
B. TSDB (Time-Series Data Management)
TSDB acts as the dedicated management and retrieval engine for high-frequency time-series data. It leverages TDengine as its core backend to provide efficient query interfaces and data ingestion capabilities.
Note
Why TDengine?
As the core Time Series Database, TDengine offers distinct advantages over traditional relational systems (e.g., MySQL), specifically tailored for autonomous system scenarios:
Performance: It delivers superior write performance for massive concurrent data streams.
Efficiency: Achieves up to 90% storage reduction through columnar storage and specialized delta encoding.
Analytics: Provides native support for complex time-window aggregation and downsampling—operations that are computationally expensive in standard SQL.
3. Infrastructure Layer
This layer provides the fundamental persistence capability, decoupled from specific hardware implementations.
Object Storage Service (OS)
OS serves as the unified storage interface for the system. While currently implemented using MinIO (a high-performance, S3-compatible local storage cluster), the architecture is designed as a generic Data Object Storage Service.
It communicates via the standard S3 protocol, allowing the underlying physical storage to be seamlessly switched between local clusters and public cloud providers (e.g., AWS S3) without affecting the upper-layer application logic.
SMART FOOD Visualizer
As one platform providing multi-sensor data, SMART FOOD has collected and integrated diverse sensor information. We developed the Minecraft Based Visualizer where each data fragment has a corresponding 3D sphere in the interactive 3D scene. Users can click on the sphere to view the data, which includes sensor information, timestamp, and other details. This visualizer allows users to explore and analyze the data in a more intuitive way.
Fig. 01: The visualizer of FOODAfter checking the fitness of data fragments and selecting the required data slices, we can get access to them by entering the download page directly.
Overview
The software contains one overview part and four data introduction parts:
FOOD Overview
Perception Data
Pre-Processing
Metrics
Tags
FOOD Overview
This panel contains an outline for the whole dataset, where it is easy to know the structure of the data. It offered six perspectives: Scene, Use Case, Environment, Sensor, Functionality, Fusion.
Perception Data
This window is on the top left of the dashboard, which provides intuitive display for the point cloud data collected. It is easy to make a rough judgment about the suitability of the sample you select.
Pre-Processing
In this part, we provide several methods and algorithms (in development) to preprocess the data. It is a place where the effects of newest algorithms can be seen.
Metrics
In addition to the results that you can directly observe, this part provides quantitative metrics for the difference between the algorithm results and the ground truth. Each algorithm provided above has corresponding metrics to evaluate its performance.